The golden ratio and face proportions
The golden ratio is a precise mathematical relationship, but a facial golden-ratio claim requires additional choices. Someone must decide which distances to measure, where their endpoints belong and how several comparisons become one result. Those choices often matter more than the familiar number 1.618. This guide explains the mathematics, separates it from thirds and fifths, and shows how to read a proportion report without confusing a drawing convention with a measured preference. It also explains what the current tool actually calculates, so you know what to expect before uploading a photograph.
Define the mathematical relationship
Imagine a line divided into a longer segment and a shorter segment. The golden ratio occurs when the ratio of the whole line to the longer segment equals the ratio of the longer segment to the shorter one. Its exact value is one plus the square root of five, divided by two. Written as a decimal, it begins approximately 1.618. This definition is about relationships between lengths. It does not specify which part of a face should supply either length or how a person should evaluate the resulting comparison.
For a purely numerical example, suppose one line in a drawing is ten units long and another is about 6.18 units long. Dividing ten by 6.18 gives a value near 1.618. That arithmetic is easy to reproduce once the two lengths are known. The difficult step in a photograph is defining and measuring the lengths consistently. A label that says “golden ratio” can skip over that step, leaving the reader with a precise-looking number but no way to determine what was actually compared.
Ask where every measurement begins and ends
A facial length might run from a forehead point to the chin, from one cheek outline to the other, or between selected eye landmarks. Each definition produces a different measurement. The visible hairline can be hard to locate, and the widest apparent cheek points can change with pose or shadow. Before interpreting a ratio, identify both endpoints for its numerator and both endpoints for its denominator. A diagram or a written landmark definition is more useful than a percentage presented without this information.
Try writing a measurement as a sentence: “distance between these two eye corners, divided by this visible eye width.” That sentence makes the operation concrete. It also reveals whether you are comparing the same thing across applications. If one tool uses pupil centers and another uses inner eye corners, identical output values do not mean identical geometry. Keep the labels attached when recording results, and do not silently replace one definition with another because both applications use a broad term such as eye proportion.
Keep thirds, fifths and the golden ratio separate
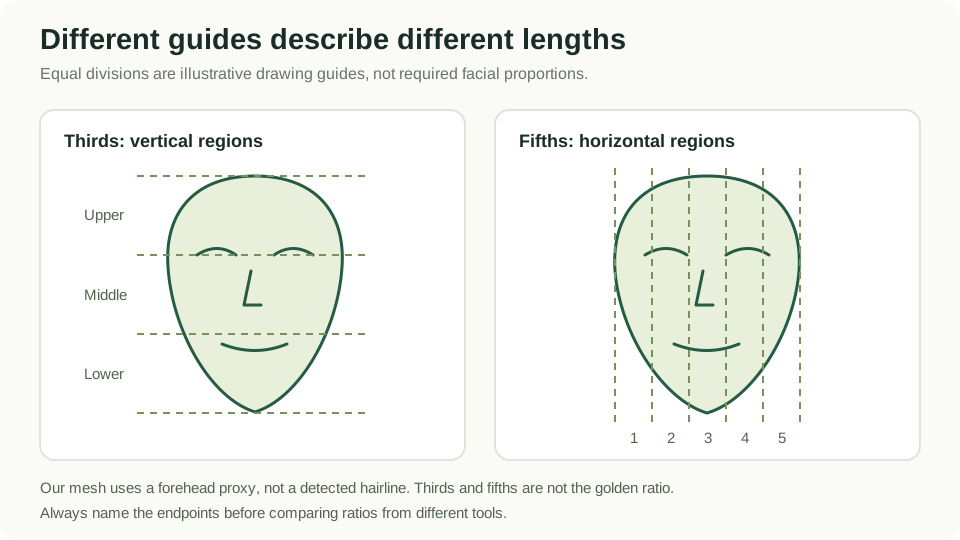
Facial thirds describe a division into upper, middle and lower vertical regions. Facial fifths describe horizontal divisions often discussed in relation to eye width and spacing. A comparison with equal thirds or equal fifths is not the same mathematical operation as comparing two lengths with 1.618. These systems can appear in the same illustration, which makes it easy to treat them as one universal template. Reading the labels separately prevents that confusion and helps explain why a report includes several distinct measurements.
The diagram on this page shows thirds and fifths as explanatory guides rather than a target mask to fit onto every face. Notice that changing the boundaries changes the size of the resulting sections. In our implementation, the upper boundary comes from a forehead mesh landmark rather than direct detection of the hairline. That detail is especially relevant to the upper third. You should not compare it with a manual hairline-based measurement without acknowledging that the endpoints differ, even if both results are labeled facial thirds.
Use a worked ratio example carefully
Suppose a schematic image has a selected width of 160 pixels and a selected height of 100 pixels. Its width-to-height ratio is 1.60. If another drawing uses a width of 162 pixels with the same height, the ratio is 1.62. Both are close to 1.618, but their closeness alone does not tell you whether the chosen endpoints are appropriate, whether the image is distorted or whether an observer prefers either drawing. The arithmetic answers a narrow question about two measured lengths.
Now imagine that the height endpoint was placed five pixels higher in the first drawing. The denominator changes, so the ratio changes even though the width stayed fixed. This is a useful way to understand measurement sensitivity. You can test the calculation with a rectangle on paper before applying it to an image. Keep these teaching numbers separate from real report values. They illustrate how a ratio behaves and are not a proposed facial reference interval, a result from a participant or a population statistic.
Inspect the image before inspecting the percentage
A face is three-dimensional, while a photograph is a projection from a particular camera position. Turning the head changes apparent widths and makes some landmarks harder to see. A close camera can also change the relative size of features at different distances from the lens. These effects mean that a ratio measured from a photograph depends partly on capture conditions. A detailed decimal does not remove that dependency. Start with a clear frontal image and retain the original file when you make comparisons.
Avoid using a stretched crop, a beauty filter or a heavily edited portrait as a measurement reference. A uniform resize preserves the proportions of the image itself, but unequal horizontal and vertical scaling changes them. Cropping can be useful for framing if it leaves the face outline intact; reshaping is a different operation. If you are unsure what an editing app has applied, export an unfiltered original and compare it visually with the edited version before deciding which file to upload for the local report.
Understand the measurements offered here
The current free tool returns eight measurements: facial symmetry, thirds, fifths, width-to-height, canthal tilt, jawline, eye spacing and midface ratio. Several are ratios, while others summarize angles or paired-point relationships. The report shows their labels and reference comparisons individually. It does not offer one scientifically validated golden-ratio beauty percentage. That distinction matters when you arrive from a search for a golden-ratio face test: the available result is a breakdown of geometry, which you can inspect more directly than an unexplained matching percentage.
Use the homepage descriptions for a brief explanation of each measurement and the methodology for the calculation settings. If your interest is specifically in eye spacing, read that measurement instead of searching the report for a single overall proportion result. If you are comparing vertical regions, look at thirds and midface ratio while noting their different endpoints. Grouping related measurements can help you ask better questions about the photograph, but it does not make them interchangeable or justify averaging their raw values into a new number.
Compare methods before comparing results
When two websites show different results, first check whether their formulas are described. Look for endpoint definitions, image-quality rules, reference intervals and any weighting used to combine measurements. A percentage may mean distance from a chosen target, the fraction of comparisons within a range, or a score transformed for display. Those meanings can produce similar-looking numbers from very different calculations. Without the definition, you cannot infer that a result of eighty on one site is better than seventy on another.
A practical comparison note can have four fields: tool name, photograph used, measurement definition and displayed result. Add the version or date if you expect the software to change. Use exactly the same original photograph when comparing methods so you do not add an extra camera difference. Even then, the detector or formula can differ. Describe the disagreement as a difference between methods, and identify which documented assumption might explain it. Do not force the results onto one scale unless a justified conversion has been provided.
Turn proportion curiosity into a clear exercise
Choose one ratio you can explain in ordinary language. Make a simple drawing with labeled endpoints and calculate the numerator divided by the denominator. Then compare that definition with the corresponding description in the report. This exercise helps distinguish the measurement itself from the reference used to interpret it. You can change one endpoint in the drawing and see how the arithmetic responds without using your own face as the subject of every trial. It is a straightforward way to learn what the ratio means.
If you then use a photograph, keep the setup consistent and ask one specific question. For example, you might investigate whether a slight head turn changes the displayed eye-spacing ratio while lighting remains similar. Record the conditions and review the original images beside the report. You are exploring the behavior of an image measurement, not conducting a study of attractiveness. A small, well-labeled comparison is easier to understand than collecting many unrelated images and treating the largest displayed value as the answer.
Read evidence and visual conventions differently
A drawing guide can be useful because it gives artists a shared vocabulary for placing features. That usefulness does not establish a universal preference for every proportion in the guide. Likewise, a mathematical relationship can be exact while its proposed application to a face remains a choice. When reading a beauty claim, ask whether the source presents an illustration, an observation from a specified sample or a validated prediction. Those are different kinds of evidence and should not be substituted for one another.
Finish by returning to the task that brought you to the page. If you wanted to understand the phrase golden ratio, the line-segment definition answers that. If you wanted a transparent photo measurement, use the individual report with its labels and references. If you wanted help choosing a photo, a guide to lighting, expression and framing is a more direct next step. The checklist below keeps those tasks distinct and provides a practical route from a familiar mathematical phrase to information you can actually inspect.
Your practical checklist
- Name the numerator and denominator of the ratio.
- Identify all measurement endpoints.
- Distinguish equal thirds or fifths from the golden ratio.
- Use an unfiltered image without unequal stretching.
- Compare tools only after reading their measurement definitions.
- Keep illustrative arithmetic separate from real measurements.
- Use the individual report rather than inventing an overall matching percentage.
References and next steps
The illustration and practical exercises are original educational examples. For the tool’s implementation details, read the measurement methodology and Google’s Face Landmarker documentation.
Explore Golden Ratio Face Test or open the free eight-measurement report.
Corrections or questions: [email protected].